charting
8 designs
Showing 8 of 8 (8 total)

This image presents a clean, technical data visualization comparing two sets of metrics, 'Standard' and 'ETPs,' using a grid-based bar chart format. The design emphasizes clarity and quantitative comparison through distinct color coding and structured layout.

This is a data visualization presenting genre popularity using stacked bar or segmented area charts, characterized by bold color blocks and clear percentage labels. The design is modern, clean, and focused entirely on conveying statistical information effectively.

The image is a collage of various data visualizations, infographics, and marketing graphics related to artificial intelligence and technology. The overall design is modern, data-driven, and professional, utilizing clean lines and strong contrasts to present complex information clearly.

The image presents a data visualization dashboard with a stark, functional design typical of technical reports or academic papers. It uses a mix of bar charts and a large donut chart to display historical productivity rate data across different years.

This image displays two mobile app screens for tracking income and expenses, characterized by a clean, modern, and data-focused design. The interface uses a light, cool color palette with distinct bar charts to visualize financial data clearly and intuitively.
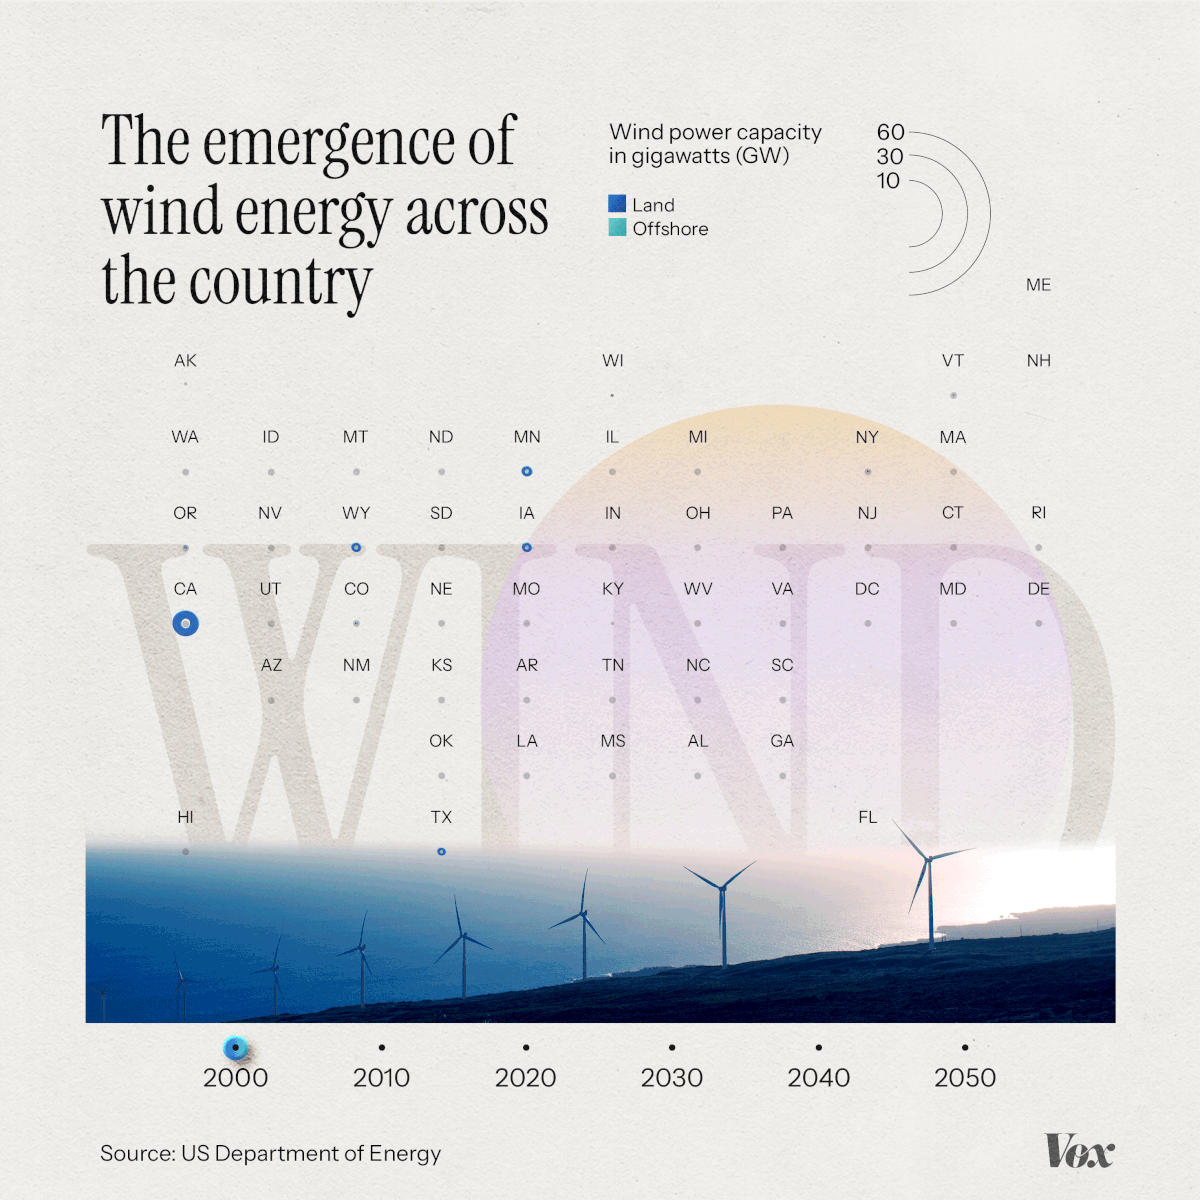
This is a clean, data-driven infographic that visually tracks the growth of wind energy capacity across various US regions over time. The design effectively blends geographical mapping, time series data points, and a thematic visual of renewable energy to convey complex information clearly.

This is a clean, professional data visualization using horizontal bar charts to compare percentages across different demographic age groups. The design relies on a simple, muted color palette and clear typography to ensure high readability and focus on the quantitative data.

This image is a minimalist line graph or chart, utilizing simple continuous lines and discrete markers to depict an upward trend. The visual language is clean, academic, and focused purely on conveying movement or data progression through precise geometric forms.